Hazard Rate Calibration Results
Our analysis processed 90 bonds across the three issuers. The calibration process successfully converged for the majority of bonds, yielding the following aggregate statistics:
Overall Universe Statistics:
- Average Implied Hazard Rate: 0.88%
- Average Option-Adjusted Spread: 53 basis points
- Recovery Rate Assumption: 60% (historical municipal average)
The chart below shows the relationship between implied hazard rates and years to effective maturity for each issuer:
Figure 1: Hazard Rate vs. Years to Maturity (Interactive)
Hazard Rate vs. Years to Maturity (Interactive) - Hover over points for bond details
Key Observations from the Hazard Rate Analysis:
1.
Issuer Clustering: As expected, bonds cluster by issuer with Casella Waste exhibiting higher hazard rates than Republic Services, which in turn trades wider than Waste Management. This confirms the market's recognition of the credit hierarchy.
2.
Term Structure Shape: Each issuer shows an upward-sloping hazard rate term structure, reflecting increasing uncertainty over longer horizons. This is consistent with standard credit theory.
3.
Dispersion Opportunities: Within each issuer's cluster, we observe meaningful dispersion around the fitted curve, indicating potential mispricing.
Relative Value Findings
The Z-score analysis identifies specific bonds that deviate significantly from fair value:
Figure 2: Z-Score Mispricing Analysis (Interactive)
Z-Score Mispricing Analysis (Interactive) - Hover over points for bond details
Top Cheap Bonds (Buy Candidates):
*Table 1: Bond Identification & Signal Strength*
| CUSIP |
Issuer |
Maturity |
Put Date |
Coupon |
Z-Score |
Signal |
| 74445MAC3 |
Casella Waste (CWST) |
2029-07-01 |
2026-06-01 |
1.10% |
2.65 |
CHEAP |
| 023445AA7 |
Waste Management (WM |
2027-04-01 |
- |
1.45% |
2.27 |
CHEAP |
*Table 2: Valuation Details*
| CUSIP |
Mkt Price |
Fair Price |
Mkt Yield |
Fair Yield |
Mkt Spread |
Fair Spread |
Spread vs Fair |
| 74445MAC3 |
98.40 |
99.01 |
5.47% |
3.80% |
121 bps |
16 bps |
+105 bps |
| 023445AA7 |
96.10 |
97.52 |
4.79% |
3.56% |
89 bps |
15 bps |
+74 bps |
Top Rich Bonds (Sell/Avoid Candidates):
No bonds currently identified as significantly overvalued (Z-score < -2).
Potential Candidates for Further Analysis:
The following bonds show moderate deviation from fair value (1-2 standard deviations). These are not strong signals but may warrant further investigation based on individual circumstances.
*Potentially Cheap (1 < Z-Score < 2):*
| CUSIP |
Issuer |
Maturity |
Put Date |
Z-Score |
Spread vs Fair |
| 13048RAJ6 |
Waste Management (WM |
2041-07-01 |
2026-04-01 |
1.84 |
+98 bps |
| 13048RAN7 |
Waste Management (WM |
2041-11-01 |
2026-06-01 |
1.10 |
+62 bps |
| 678438AC6 |
Waste Management (WM |
2039-07-01 |
2029-07-02 |
1.09 |
+59 bps |
Cross-Issuer Analysis
The boxplot analysis reveals the distribution of hazard rates within each issuer's bond universe:
Figure 3: Hazard Rate Distribution by Issuer
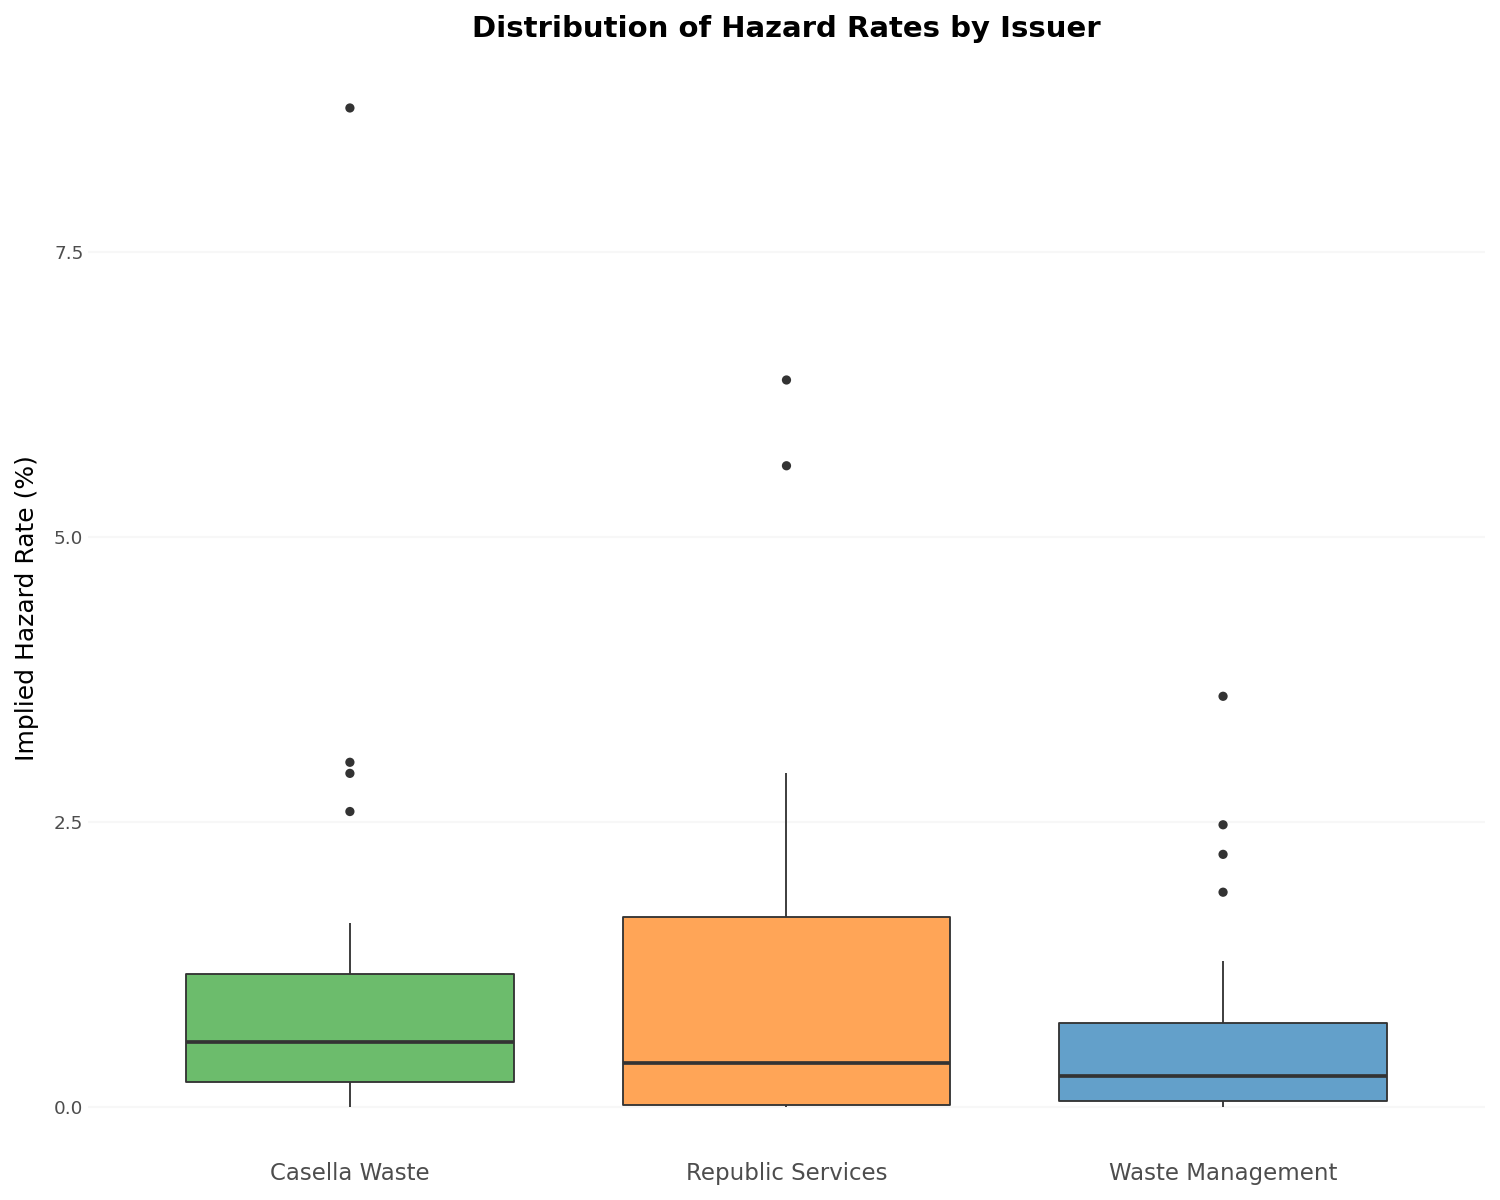
Hazard Rate Distribution by Issuer
Observations:
- Waste Management shows the tightest distribution, reflecting its larger, more liquid bond universe
- Republic Services exhibits moderate dispersion with some outliers worth investigating
- Casella Waste shows the widest range, consistent with smaller issue sizes and less liquidity
OAS vs. Duration Analysis
The OAS-duration relationship provides a risk-adjusted view of value:
Figure 4: OAS vs. Duration Analysis (Interactive)
OAS vs. Duration Analysis (Interactive) - Hover over points for bond details
This chart shows how spread compensation varies with duration exposure across issuers. Bonds with higher OAS at similar durations offer better risk-adjusted value. Red borders indicate bonds flagged as potentially mispriced based on our Z-score analysis.